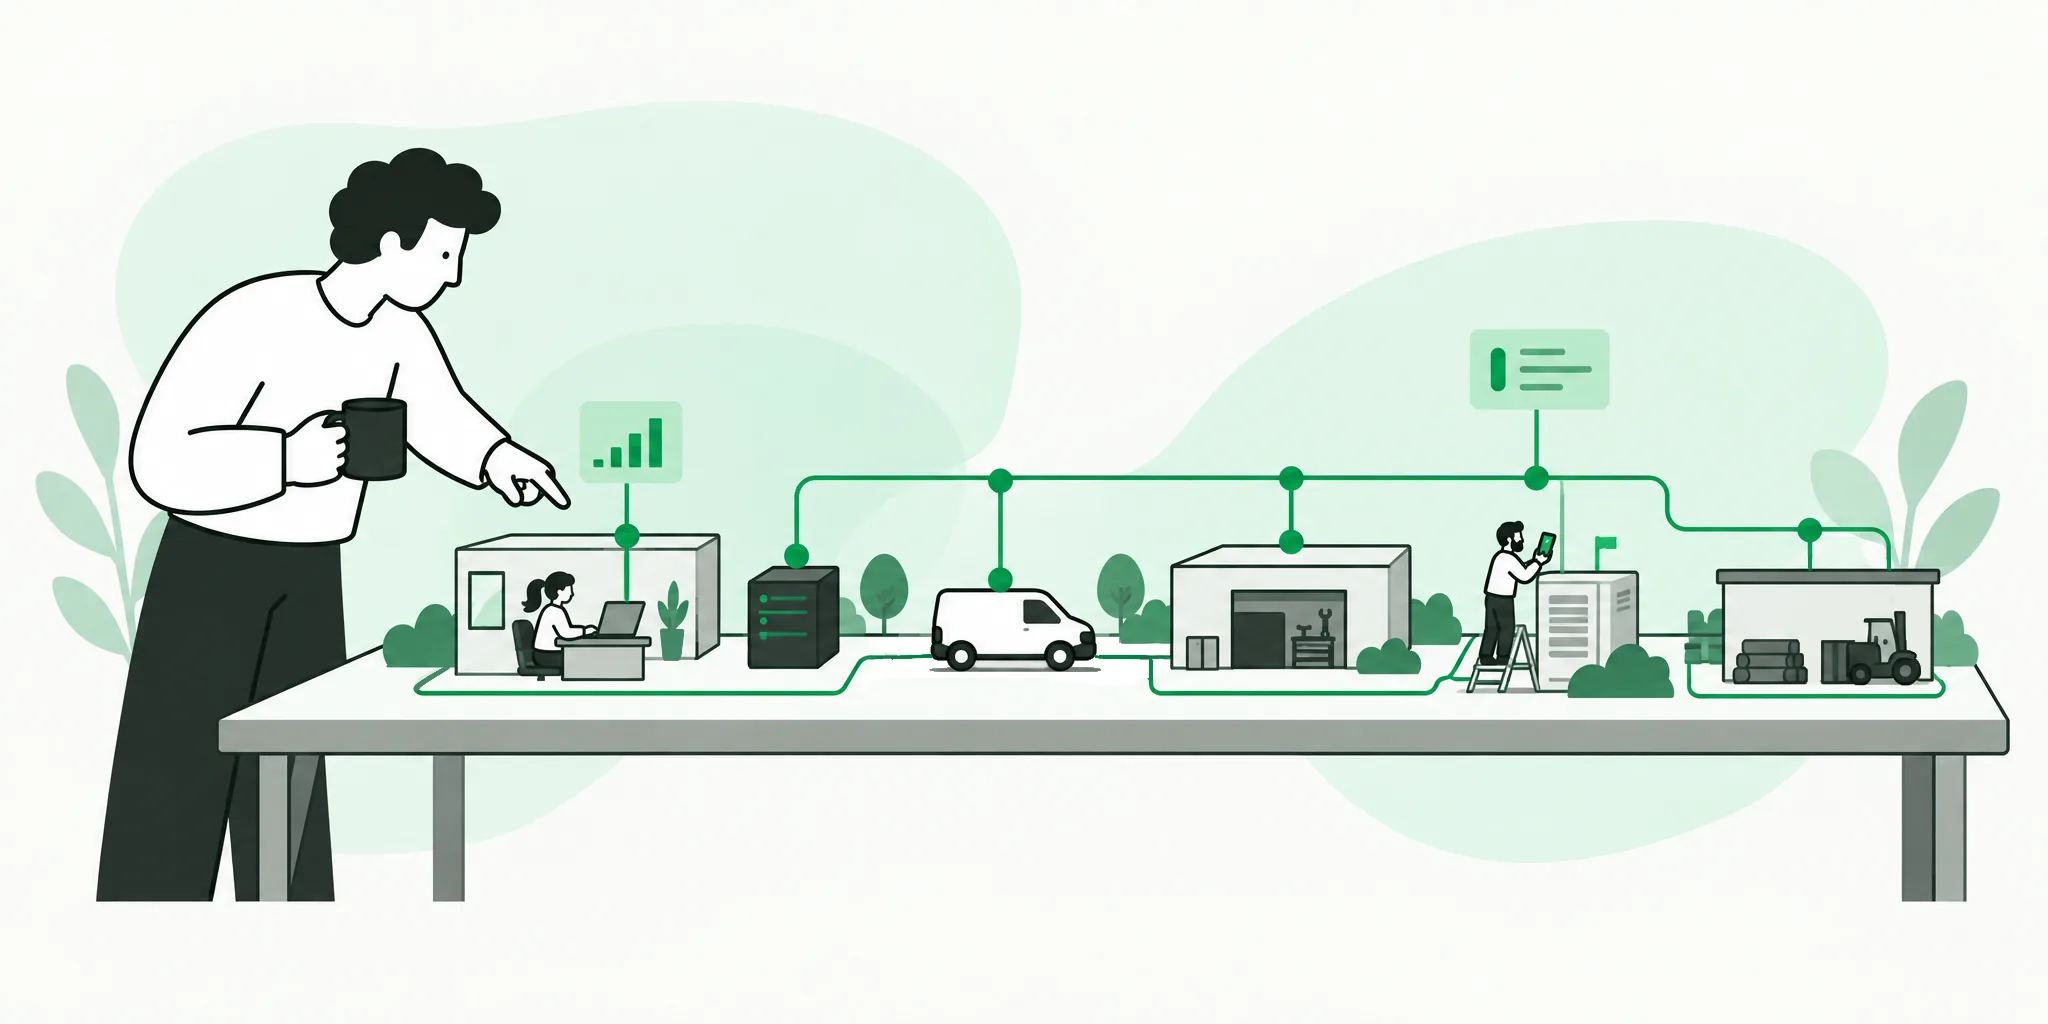
Most operations run on several tools at once: a job system for the back office, a field app or WhatsApp for technicians, spreadsheets for tracking, and a separate tool for reporting. Each covers part of the business. None covers the whole. So when a manager wants to know what's actually happening, they have to piece it together by hand.
Connecting every part of the business to one platform, with one operational dashboard on top, removes that work.
Why a dashboard alone isn't enough
When managers ask for a dashboard, what they really want is to be confident about the state of the operation without chasing anyone for updates. A new screen doesn't give you that. A dashboard is only as good as the data feeding it. If that data is scattered across systems, entered late, or partly missing, the dashboard just shows the gaps more clearly.
Reliable visibility comes from how the data is captured. Back office, field teams and management all need to work in the same system, so every update lands in one place the moment it happens.
What you get when everything is connected
- Live status, not end-of-day updates. A technician updates a job from their phone and the coordinator and manager see it immediately. No calls, no re-entry.
- Records that link up. Every job, site, record and person is connected, so reports are complete because the data was captured where the work happened.
- One version of the truth. No separate admin system, field app and reporting tool disagreeing with each other.
- The right view for each role. Permissions let every team member see what's relevant to them, and managers see everything.
- Sites you can compare. Every location records work the same way, so comparing performance across sites takes a single query instead of a day of reconciling spreadsheets.
- Better decisions. Structured, consistent data makes it possible to spot patterns and systemic issues early and to plan resources with confidence.
Why stitching SaaS tools together rarely gets you there
Each SaaS tool is built to be excellent at one thing, with its own data model and sync schedule. Integrating three of them so they share data in real time, in a way that matches your actual workflow, usually costs more than the tools themselves. It also needs maintenance every time a vendor ships an update.
The practical alternative is to take your core workflows, such as job assignment, status tracking, back-office records and reporting, and build one platform around them.
How Bitnatives builds operational dashboards
This is what we specialise in. We build operational platforms and dashboards around the way your team already works. Field, back office and management share one system, and the dashboard shows what is actually happening, not what someone remembered to report.
You can see examples across different industries in our solutions, from a facilities management dashboard and maintenance management software to live event operations and a vessel supply ERP. For a detailed example, this AI intake case study shows how a maintenance team cut reporting friction without adding admin work.